Restricted driver licence tests too restricted in Auckland?
Recently a friend of mine tried to pass unsuccessfully the restricted driving test. The question arose, whether there were places with higher likelyhood to pass the test. Fortunately, NZTA publishes their pass rates.
To analyse the data, I will be using my new toy pandas, a spreadsheet for geeks.
import pandas as pd
d = pd.read_csv('Driver_licence_pass_rates.csv')
The downloaded comma separated values (csv) is read into a dataframe. The output gives an overview over the data. 2145 rows, broken down into different categories like ’_TEST_YEAR’, ‘REGION’, ‘TEST_TYPE’, ‘AGE_GROUP’…
d.head
<bound method NDFrame.head of       _TEST_YEAR             REGION   TEST_TYPE    AGE_GROUP  TOTAL_TESTS  0           2010    AUCKLAND REGION        FULL  16-24 years        14915
1           2010    AUCKLAND REGION        FULL  25-29 years         5932
...          ...                ...         ...          ...          ...
2143        2020  WELLINGTON REGION  RESTRICTED  35-39 years          476
2144        2020  WELLINGTON REGION  RESTRICTED  40 and over          585

      TOTAL_PASS  TOTAL_FAIL  PASS_RATE  OBJECTID
0          12389        2526       0.83         0
1           4587        1345       0.77         1
...          ...         ...        ...       ...
2143         255         221       0.54      2143
2144         241         344       0.41      2144

[2145 rows x 9 columns]>
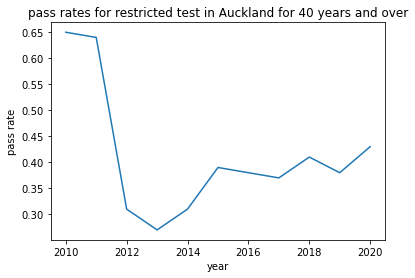
Next, the data needs to be filtered down, to answer the question which is: What are the pass rates for the restricted test for 40 years and older in Auckland?
r = d[d['TEST_TYPE'] == 'RESTRICTED']
r40 = r[r['AGE_GROUP'] == '40 and over']
r40a = r40[r40['REGION']=='AUCKLAND REGION']
r40a.['PASS_RATE'].plot(legend=True, xlabel='year', ylabel='pass rate', title="pass rate for ages over 40 in Auckland")
Then, we want see how Auckland compares with the other regions.
r40.groupby('REGION')['PASS_RATE'].plot(legend=True, xlabel='year', ylabel='pass rate', figsize=(10,14), title="pass rate for ages over 40 in different regions")
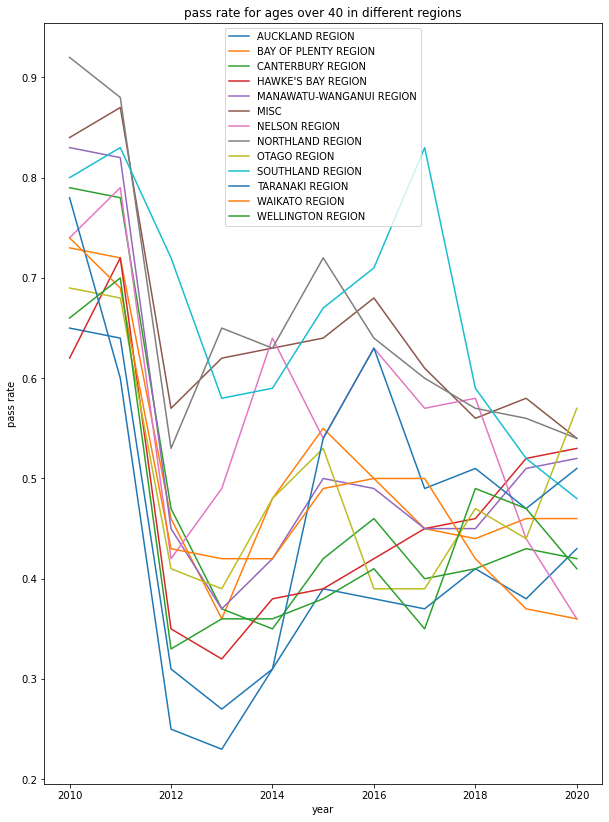
Taking the test in Northland, Otago or in the smaller regions like West Coast, Gisborne, Marlborough or Tasman (= MISC) would definitely increase your chances.
We had a look at the age group 40 and over. How do they compare with the other age groups?
r.groupby('AGE_GROUP')['PASS_RATE'].mean()
AGE_GROUP
16-24 years    0.658252
25-29 years    0.623287
30-34 years    0.604965
35-39 years    0.581469
40 and over    0.526853
Name: PASS_RATE, dtype: float64
Age may make you wiser, but not a better driver in the eyes of the testers. Although insurances disagree with this finding for the under 25 year olds.
The graphs for the regions reveal a curious dip after 2011. Let’s have a look how if that picture persists on restricted tests in all age groups nationally:
r.groupby('_TEST_YEAR')['PASS_RATE'].mean().plot.line()
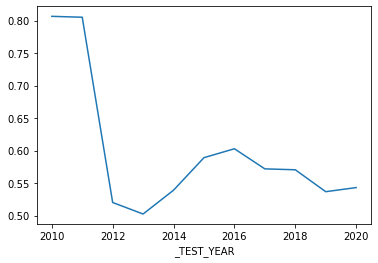
A similar picture emerges. Who was in charge or more precisely who was the transport minister in 2012? Gerry Brownlee. Although it would be convenient to spin a conspiracy theory, a search shows that on the 1 August 2011, the age to apply for a learner's licence was raised from 15 to 16. Mr Brownlee had nothing to with that. Apparently the NZTA tightened the exam requirements at the same time. Further interesting questions could be investigated if the data provided a breakdown by gender and ethnicity.